
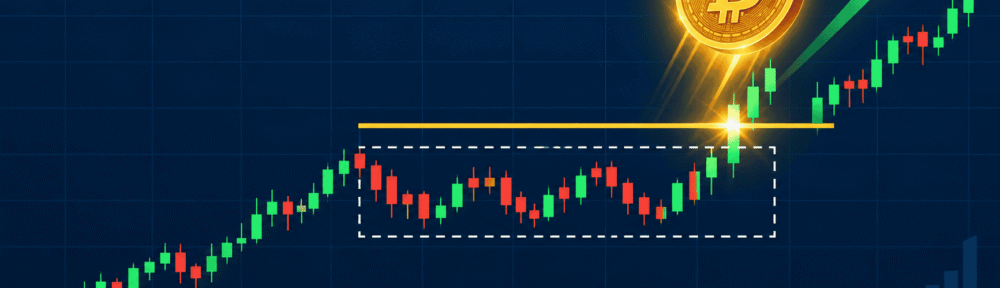
Bitcoin just did something it hasn’t done in months: it broke decisively above $81,000 and briefly touched $85,134 on September 21, 2026, an 8-month high. For a market that spent most of September grinding inside a defined range below $82,500, this rally has caught a lot of investors off guard. Naturally, the question everyone’s asking is whether this is the start of a genuine recovery or just another bear market bounce before more downside.
Here’s what the chart actually shows, what triggered the move, and why analysts are still split on the answer.
The Technical Picture: This Was a Range Breakout, Not Just a News Bounce
Before looking at the headlines, it helps to understand the setup Bitcoin was breaking out of.
Earlier in the cycle, BTC built a base around $58,000 to $67,000, then broke out of it on strong volume expansion and rallied rapidly toward the $82,000 zone. From there, it spent roughly three weeks (early September through September 21) consolidating inside a well-defined range of about $76,000 to $82,500, with buyers repeatedly defending the lower end of that range. Volume, which had spiked during the initial breakout from $67,000, cooled off during this consolidation phase, a fairly normal pattern for a market pausing after a big move rather than reversing.
Mid-September also brought a golden cross, where the 50-day moving average crossed above the 200-day moving average for the first time this year. This is a classic medium-term bullish signal that traders watch closely.
By September 21, price had cleared the top of that range entirely. Bitcoin was trading above its 20-day, 50-day, and 200-day moving averages, all stacked in bullish order and rising, which is generally read as a trending market rather than a range-bound one. In short, this wasn’t a single-day pop on good news. It was a break above a multi-week range that had already been quietly building a bullish structure underneath it.
What Triggered the Breakout
The technical setup explains how Bitcoin was positioned to move. The news explains why it moved when it did.
Sustained ETF inflows. Spot Bitcoin ETFs avoided a second straight week of losses, with strong inflows on September 18 helping push price toward the top of the range. Continued institutional buying through an ETF wrapper is one of the clearer signs that demand hasn’t dried up.
Resilience against bad news. Bitcoin shrugged off two pieces of news that would normally hit it hard: the Fed’s 25-basis-point rate hike on September 16, and the Senate blocking the Transparency Act (also called the CLARITY Act) a day earlier. Analysts like Mitchell Askew of Blockware pointed out that this kind of resilience suggests sellers may have exhausted their supply, historically a sign a market is closer to the end of a bottoming process than the middle of one.
A drop in oil prices. Lower oil prices eased some of the inflation pressure weighing on risk assets generally, adding a macro tailwind on top of the technical setup.
By September 21, the total crypto market cap had climbed to roughly $2.81 trillion, up 1.3% in a single day, with Ethereum and BNB also posting solid gains.
Why This Might Not Be the Bottom Yet
Before getting too excited, it’s worth remembering where this breakout is happening: inside a broader downtrend that most cycle analysts still expect to bottom out later this year.
Bitcoin’s all-time high was $128,198.07, set in October 2025. Even after this week’s surge, BTC remains well below that peak, and multiple independent analyses (from Glassnode, Mudrex, and cycle analyst Benjamin Cowen among others) still point to October to December 2026 as the most likely window for the actual cycle bottom, with price targets as low as $50,000 to $57,000 based on the 200-week moving average and historical drawdown patterns.
The reasoning behind that view: Bitcoin’s four-year halving cycle has historically bottomed 24 to 28 months after each halving event. The last halving happened in April 2024, which puts the statistical bottom window squarely in the second half of 2026, right around where we are now, and where the market may still be heading before it turns.
In other words, a strong technical breakout doesn’t cancel a multi-month macro pattern. Bear market rallies inside a larger downtrend are common, and Bitcoin has had several sharp bounces in 2026 already, including a run of over 20% off the August lows, that didn’t mark the actual bottom.
What Would Actually Confirm a Bottom
Analysts generally point to a few signals that separate a real trend reversal from a temporary bounce:
Price reclaiming and holding the 200-week moving average. This sits around $57,000 currently and has historically marked the floor of every prior cycle bottom.
A daily close above the $82,000 to $82,500 resistance zone on expanding volume. A breakout on light volume is weaker evidence than one confirmed by strong buying pressure.
Sustained ETF inflows over multiple weeks, not just a single strong day, showing institutional demand is structural rather than opportunistic.
On-chain data showing accumulation by long-term holders rather than short-term traders chasing the bounce.
Some of these are lining up (the moving average structure, the ETF flows), but others, like multi-week volume confirmation above $82,500, are still unconfirmed. What happened this week is a genuine technical breakout with real bullish structure behind it, but it’s not yet the kind of fully confirmed shift that historically marks a cycle low.
The Bottom Line for Filipino Investors
If you’re holding Bitcoin or thinking about buying in, the honest answer is that nobody knows for certain whether this is the turn or another leg in a longer bear market. What’s clear is that volatility is far from over. Bitcoin has swung more than 20% in either direction multiple times this year alone, and a strong breakout, however encouraging, doesn’t erase months of macro uncertainty around Fed policy and stalled US crypto legislation.
If you’re investing in crypto through Philippine platforms like PDAX, Coins.ph, or a CASP-registered exchange, treat this the way you’d treat any high-volatility asset: only invest money you can afford to lose, avoid chasing green candles, and have a plan for both directions before you buy.
Frequently Asked Questions
Is Bitcoin’s bear market over?
Not confirmed yet. While BTC broke out of its multi-week range to hit an 8-month high this week, most cycle analysts still expect a bottom sometime between October and December 2026 before a sustained recovery begins.
Why did Bitcoin suddenly break out in September 2026?
Technically, BTC broke above a three-week consolidation range between roughly $76,000 and $82,500, backed by a golden cross earlier in the month. The breakout was triggered by continued spot ETF inflows, resilience despite a Fed rate hike and a blocked Transparency Act vote, and easing oil prices.
What price level would confirm a real bottom?
Analysts watch the 200-week moving average, currently around $57,000, along with a confirmed daily close above $82,500 on strong volume, sustained multi-week ETF inflows, and on-chain accumulation data.
Should I buy Bitcoin now?
That depends on your risk tolerance and investment horizon. Bitcoin remains highly volatile, and this breakout is happening inside a broader downtrend that hasn’t been confirmed as over. Only invest what you can afford to lose.
Blogger’s Corner
Grabe, ang bilis talaga ng crypto market, no? Isang linggo lang, biglang umakyat ng ganito kalaki. Pero based sa mga previous cycles natin (2018, 2022), hindi ito ang unang beses na may malaking bounce sa gitna ng bear market. Kaya kung nag-iinvest ka sa Bitcoin, huwag masyadong ma-excite sa isang magandang breakout, at huwag din masyadong ma-panic sa isang masamang linggo. Dollar-cost averaging pa rin ang pinaka-sane na approach dito.
Disclaimer: This article is for informational purposes only and does not constitute financial or investment advice. Cryptocurrency investments are highly volatile and carry significant risk of loss. Always do your own research and consult a licensed financial advisor before making investment decisions.